PollMaker's reporting
capabilities distinguish it from other data collection applications.
PollMaker excels at providing you with information from your polls
in real-time. If you desire, you can run reports right at your
polling kiosk. PollMaker provides six built-in reports so that you
can see your polling data in the way that best fits your
needs.
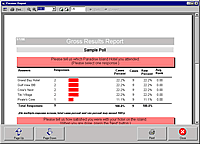 |
Gross Results
Shows summarized statistics,
including number and percentage of responses for each answer
and total responses, for the question screens in the
poll |
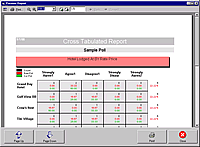 |
Cross-Tabulated
Allows you to cross-tabulate the
results for two or more question screens in your poll. As a
result, you can associate the responses to the answers of two
or more question screens (i.e. view how respondents that
answered a selected question answered each of the other
questions). |
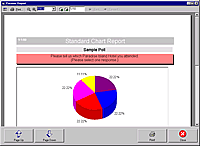 |
Results Chart
Presents summarized statistics for
the question screens in the poll in 3-D pie or bar
charts |
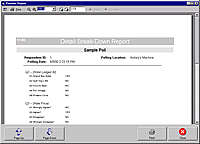 |
Detail Break-Down
Shows response data for each
respondent that takes the poll |
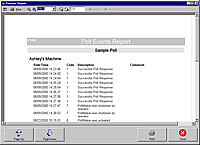 |
Event Log
Shows a summary of polling events for
a polling kiosk, including successful poll responses,
launching of sub-polls and poll errors. |
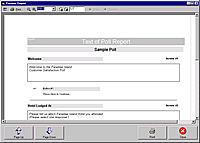 |
Q & A List
Shows the text of each question
and answer on the polling screens in the
poll. |
In addition to these
reports, PollMaker also provides an ASCII Export Module that is run
using the same method as these reports. This module allows you to
export your poll data into an ASCII text file for importing into
other database applications, spreadsheet applications or statistical
analysis tools. With this capability, you have the power to go
beyond reporting in sharing your raw poll data with other
applications and personnel within your organization for specialized
analysis or other purposes.
Generating
Reports
Reports can be accessed
in one of two ways in PollMaker. First, you may run reports from
Poll Manager by selecting the "Generate Report" button on the Quick
Pick Screen (figure 1).
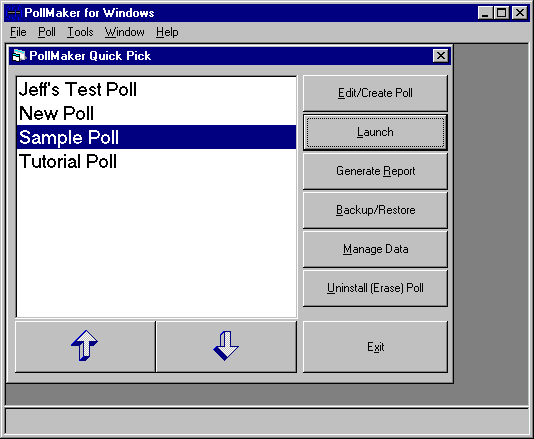
Figure
1: Poll Manager Quick Pick Screen
You may also run
reports at a kiosk from the Polling Engine while a poll is running.
In this case, you can access reports by providing the Console Touch
Code for that kiosk (see Stopping
Polls on the Run Polls page). When the Console Touch Code is
provided, the Polling Engine stops the poll and displays the
Operator Console (figure 2). On the Operator Console, select the
"Reports" button.
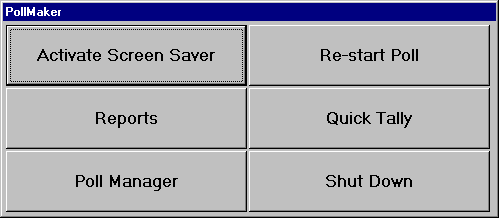
Figure 2: The Polling Engine Operator
Console
Using either
of these methods, the Poll Reports Dialog Box (figure 3) will be
displayed showing a list of reports that may be run for the current
poll. When you select the "Run!" button for a report, a wizard for
that report will step you through all of the optional settings for
that report and then will run the report. Some of the report options
that you can control through the report wizard include the dates of
the polling data, the poll questions and the titles to be included
on the report. In addition, you can also specify statistical
weighting to be applied to your poll data and create report
templates through the report wizard's interface (see Report
Templates and Statistical Weighting below).
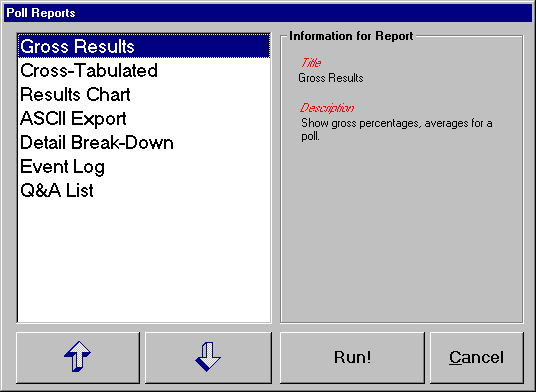
Figure 3: Poll Reports Dialog Box
You have the
option of displaying your reports on the screen or printing them to
a printer or a file. If you choose to run a report to the screen,
the Preview Report window (figure 4) will open containing your
report. You will be able to scroll through the report, and you may
also choose to print the report on a printer. If you choose to print
your report to a file, your report is created in rich-text format
(.rtf) so that it can be opened in several different word-processing
applications.
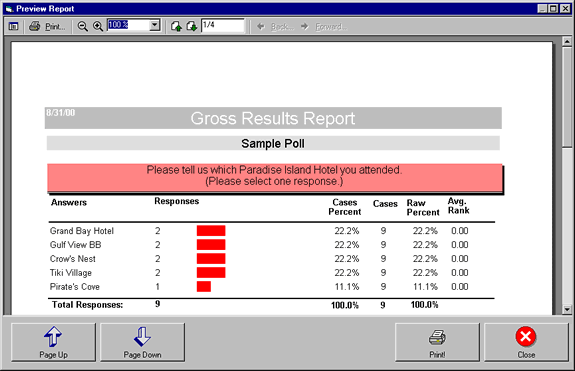
Figure 4: Preview Report Window
Report
Templates
PollMaker
also allows you to create report templates that save all of the
options for a report that you selected through the report's wizard.
Therefore, in the future each time that you want to run the same
report with the same options, you can save time by running the
template, instead of having to re-enter all of the same options each
time. When you create a report template for a poll, it will be shown
in the Poll Reports Dialog Box with the other PollMaker reports
(figure 3).
Statistical
Weighting
Another
powerful feature of PollMaker reporting is the ability on several of
these reports to create statistically weighted results. With this
feature you can specify that one answer item in the poll should
represent a certain percentage of the responses for its related
question. When this option is selected, PollMaker duplicates the
answers of respondents that have already taken the poll so that the
specified answer weighting is achieved within the poll
results.
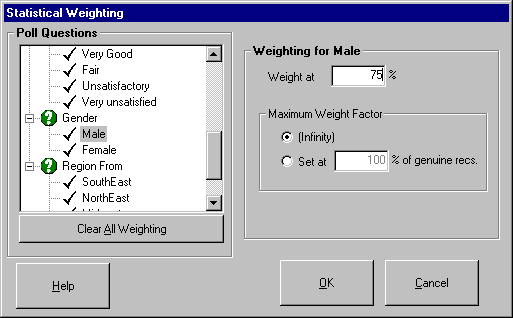
Figure 4: Statistical Weighting Dialog
Box
To take a
simple example, assume that you have run a poll that asks
respondents to provide their gender on one of its poll screen. Five
people have taken the poll, and three of those respondents selected
the "Male" answer item for the gender question (60% of respondents).
If you wish to see a report of hypothetical poll results as if 75%
of respondents had answered "Male," you would specify a statistical
weighting of 75% for the "Male" answer item in the Statistical
Weighting Dialog Box (figure 5) of the reporting wizard. Then when
you run this report, PollMaker would duplicate the answers of the
three respondents that answered "Male" to the gender question. As a
result, this report would show what the poll results would look like
had 75% of the respondents answered "Male" to the gender question.
With the duplicated responses, the poll report would actually show
that the poll had had eight respondents (five real respondents and
the three duplicated respondents to achieve 75% or six out of eight
"Male" responses). Therefore, statistical weighting assumes that the
additional respondents would answer the questions in the poll in the
same way as those respondents that have already taken the poll.
These duplicate
responses are only used to create this report and in no way impact
or permanently change your poll response data.
Return to How PollMaker
Works.
|

